Source to outcome predictor
The Source To Outcome Predictor (STOP) is a Graphical User Interphase (GUI) developed by NIVAs Computational Toxicology Program (NCTP) as a front-end tool for NIVA Risk Assessment database.
 Knut Erik Tollefsen
 Viviane Girardin
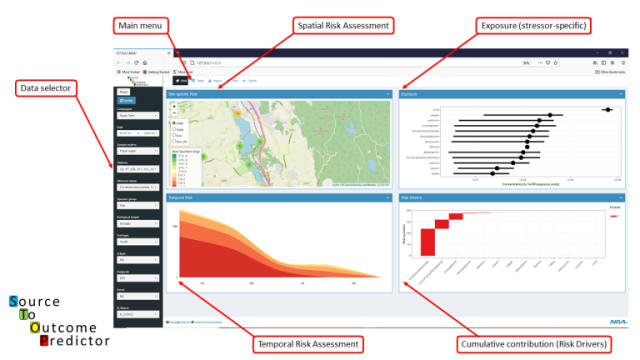
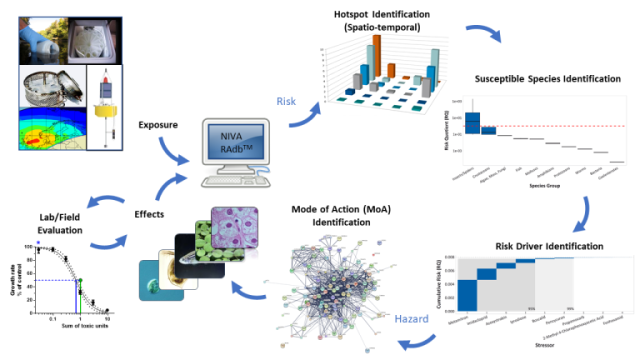
The STOP-GUI facilitates rapid and consistent visualizations of exposure, hazard and risk assessment of single chemical and non-chemical stressors and combinations (mixtures) of these. The NIVA RAdb and STOP-GUI utilize the Source To Outcome Pathway (STOP) framework to compile, assemble, integrate and visualize case (campaigne)-specific exposure data, spatial and temporal risk predictions, susceptible species, identification of risk drivers (most toxic stressors) and most relevant modes of action (MoAs).
Background
Use of available exposure and effect data are key to performing hazard and risk assessment of chemicals and non-chemical stressors, and compiling different sources of data are often done in a case-by-case manner. Processing data is thus highly cumbersome and time-consuming, whereas the availability of data is a large source of uncertainty in resulting assessments. The STOP-GUI has been developed as a front-end visualization tool for data available in and analysed within the NIVA Risk Assessment database (NIVA RAdb) tool. The STOP-GUI currently facilitates visualization of exposure, effect and risk predictions for different case studies where input of modelled and/or measured exposures are used to predict the exceedance of safe response thresholds for specific molecular, cellular and/or functional responses as well as for adverse effects relevant for regulatory processes. The STOP is informed by data organisation principles such as the Aggregate Exposure Pathway (AEP) and Adverse Outcome Pathway (AOP) to ensure consistent handling of relevant data for research and next generation (NextGen) risk assessment.
Graphical user interface
The Graphical User Interphase (GUI) is build as a Shiny App and run from a LINUX server hosted by NIVA. The GUI is currently a stand-alone application that uses flat file data extracts from NIVA RAdb, but its envisioned to directly interact with NIVA RAdb in the future. The GUI is currently tested with several internal and external case-study owners to improve functionality and ensure a broad user community applicability.