NIVA Risk assessment database
NIVAs Computational Toxicology Program (NCTP) has developed a database tool that facilitates rapid and consistent Hazard and Risk Assessment of single chemical and non-chemical stressors and combinations (mixtures) of these.
- Nøkkelforskere
-
 Knut Erik Tollefsen
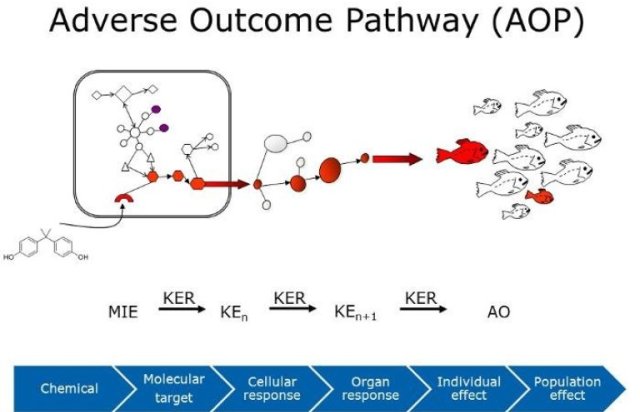
The Database tools utilize concepts outlined by the Aggregate Exposure Pathway (AEP) and Adverse Outcome Pathway (AOP) to compile, assemble, integrate and visualize data from different levels of biological organization. Potential outcome from different modules of the database include identification of spatial risk, temporal risk, susceptible species, risk drivers, relevant toxic endpoints (i.e. mode of action) for a given exposure scenario. A specific Source To Outcome Predictor (STOP) has additionally been developed to visualize the data available and analyses performed by NIVA RAdb.
Background
Use of available exposure and effect data are key to performing hazard and risk assessment of chemical and non-chemical stressors, and compiling different sources of data are often done in a case-by-case manner. Processing data is thus highly cumbersome and time-consuming, whereas the availability of data is a large source of uncertainty in resulting assessments. The NIVA Risk Assessment database (NIVA RAdb) has been developed as a module-based database tool to facilitate the assembly, organization, integration, visualization and quality assurance of exposure and effect information in order to speed up and perform consistent handling of relevant data for research and regulatory purposes.
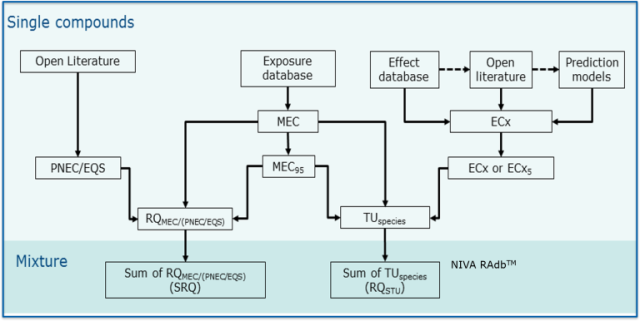
The NIVA RAdb compile available experimental and predicted (computational) effect data that range from molecular and cellular responses characterizing the mode of action (MOA), typically derived from high-throughput and high-content (in vitro) bioassays, to (apical) adverse data derived from whole organism bioassays of potential regulatory relevance. These effect data are assembled within the context of Adverse Outcome Pathways (AOPs) by anchoring data to initial cellular responses referred to as molecular initiating events (MIE), to key events (KE) at the cellular/organ level and finally to adverse outcomes (AO) at the individual or organism level
The resulting multi-level assemblies of data can be used within hazard assessment to identify the MOA of one or more stressors, to link molecular responses to higher organization level effects and to identify potential stressors among large assemblies of pollutants that can give rise to a given AO. The NIVA RAdb also supports risk assessment by calculating risk quotients (RQs) of single stressors and combinations of these (mixtures) on basis of exposure and effect data, and can identify risk drivers (stressors with largest risk contributing potential), relevant toxic endpoints (i.e. across different MIE, KE and AO), susceptible species and species sensitivity distributions for a given exposure scenario. Recent development includes integration of non-chemical stressors such as ionizing radiation, non-ionizing radiation, nanoparticles, nano- and micro-scaled plastics. The current version (v1.3) covers aquatic species, albeit effort to expand this to other species and environmental matrixes is ongoing.
The NIVA RAdb combine principles of the Aggregated Exposure Pathway (AEP) to link source, emission, fate and exposure to that of the AOP and collectively support holistic Source To Outcome Pathway (STOP) predictions. The exposure, hazard and risk predictions are visualized through a STOP.